
KELLY CRITERION SIMULATOR/CALCULATOR
This Kelly Criterion simulator models how a bankroll can evolve across repeated bets when stake size is determined by a Kelly-based capital allocation rule. The model is probabilistic, path-dependent, and designed to show how growth, volatility, and drawdowns interact under fixed assumptions. Rather than producing a single forecast, the simulator generates many possible bankroll paths under the same input conditions.
The purpose is to show the structural behavior of the Kelly Criterion inside a controlled model, not to provide betting advice, guarantees, or real-world decision support.
What the Kelly Simulator Models
This Kelly Criterion simulator models bankroll evolution as a multiplicative process. Each bet changes total capital by a fraction of the current bankroll, which means growth and loss compound over time rather than accumulating in a flat linear way.
The simulator is built around repeated trials with fixed probability and fixed odds. Because the same capital allocation logic is applied across many simulated paths, the output can show how the Kelly Criterion changes long-run growth behavior, volatility, drawdown depth, and tail outcomes under stable model conditions.
The result is not a single expected bankroll number. It is a distribution of possible outcomes shaped by edge, odds, variance, and path dependency.
How the Kelly Criterion Works
The Kelly Criterion is a capital allocation formula used to determine what fraction of bankroll should be risked when a bettor or investor believes a measurable edge exists. In simple terms, the Kelly fraction increases when the perceived edge is stronger and decreases when the edge is weaker or the payout structure is less favorable.
Inside this simulator, the Kelly Criterion is treated as a formal bankroll sizing rule. The model does not decide whether an edge is real. It only shows what can happen to capital when a fixed edge assumption is translated into repeated Kelly-based exposure.
This matters because bankroll growth is not determined by win rate alone. It depends on the relationship between probability, odds, and stake size. A positive edge can still produce severe volatility if exposure is too aggressive, while a smaller capital fraction may reduce growth but also reduce drawdown pressure.
Kelly Criterion and Growth Optimality
The Kelly Criterion is known for growth optimality in the narrow mathematical sense of maximizing expected logarithmic utility. Within a repeated multiplicative process, that means maximizing long-run geometric growth under the assumptions of the model.
That property is often misunderstood. Growth optimality does not mean smooth growth, safe growth, or low-stress growth. It means the formula targets maximum asymptotic growth, and that objective naturally comes with trade-offs.
Higher expected growth under full Kelly usually means greater volatility, deeper interim drawdowns, and wider outcome dispersion. A bankroll can still experience long and uncomfortable periods of instability even when the model is theoretically growth-optimal over the long run.
Why Bettors Use Kelly-Style Bankroll Models
The Kelly Criterion is commonly discussed in betting environments where capital allocation matters as much as prediction quality. That includes sports betting, model-based betting, some forms of advantage play, and other situations where a participant believes odds and true probability are misaligned.
In those environments, the main question is not only whether a bet has positive expected value. The question is also how much of the bankroll should be exposed when the edge is believed to exist. That is where Kelly-style bankroll models become relevant.
The Kelly Criterion gives a formal answer to the sizing problem. It does not create an edge, and it does not verify whether the underlying probability estimate is correct. It only converts assumed edge and odds into a capital fraction inside a repeated-risk framework.
This is one reason the formula attracts serious attention from disciplined bettors. It sits at the intersection of expected value, bankroll growth, and survival risk rather than focusing on win rate alone.
Full Kelly, Fractional Kelly, and Risk Exposure
Full Kelly is the mathematically complete capital fraction implied by the formula under the model assumptions. Fractional Kelly reduces that fraction, often to half-Kelly or quarter-Kelly, while keeping the same general logic of edge-based sizing.
This matters because full Kelly is often too aggressive for real-world use when the input assumptions are uncertain. Even if the estimated edge is positive, full Kelly can create sharp drawdowns and highly unstable bankroll paths when the probability estimate is noisy or the market conditions are less stable than assumed.
Fractional Kelly changes that trade-off. It reduces expected long-run growth relative to full Kelly, but it also reduces volatility, lowers drawdown pressure, and makes the bankroll path less sensitive to estimation error. For that reason, many advantage-oriented bettors treat fractional Kelly as a more robust practical variation of the same capital allocation idea.
This simulator can be used to observe that difference directly. By reducing the applied fraction, users can compare how bankroll behavior changes when growth is sacrificed in exchange for smoother risk exposure.
Why Probability Error Matters More Than the Formula
The most important real-world limitation of the Kelly Criterion is usually not the formula itself. It is the quality of the probability estimate fed into the formula.
If the edge estimate is too optimistic, the Kelly fraction can become too large. That leads to overbetting, which is one of the fastest ways to turn a theoretically sound capital allocation rule into a fragile bankroll process. In practice, small errors in estimated probability can materially change optimal stake size, especially when the edge is thin.
This is why advanced users often focus less on the elegance of the formula and more on the reliability of the inputs. A clean Kelly equation does not solve noisy modeling, line movement, incomplete information, hidden correlation, or unstable market conditions.
In that sense, the real challenge is not understanding the Kelly Criterion. The real challenge is knowing whether the assumed edge deserves to be trusted at all.
Kelly Criterion, Smart Betting, Arbitrage Betting, and Micro Betting
The Kelly Criterion is closely related to several concepts explored by advantage-oriented bettors, but it should not be confused with them.
Smart betting is a broad and informal term, not a formal mathematical model. It usually refers to disciplined betting behavior built around price awareness, expected value, bankroll control, and selective exposure. Kelly-based staking can be part of that framework, but the Kelly Criterion itself is only a bankroll sizing rule.
Arbitrage betting is different again. Arbitrage betting seeks to lock in pricing inefficiencies across books or markets so that the position is profitable regardless of outcome. The Kelly Criterion does not create arbitrage. It addresses how bankroll exposure may be sized when edge and payout are known or assumed.
Micro betting introduces another layer of complexity. In micro betting markets, decisions are made on short time horizons, prices can update quickly, and execution speed matters more. That environment can make Kelly-style staking harder to apply because the assumed edge may decay rapidly, the number of decisions can rise sharply, and model error can become more costly when betting frequency increases.
These topics are connected because they all sit inside the broader world of edge, pricing, and exposure. The Kelly Criterion belongs in that ecosystem as a capital allocation mechanism, not as a complete betting strategy.
What the Simulator Reveals About Drawdowns and Volatility
One of the main strengths of Kelly simulation is that it makes hidden bankroll risk easier to see. A theoretical edge can still produce highly uneven outcomes when exposure is repeated over time.
By generating many independent bankroll paths, the simulator shows that identical assumptions can still produce very different trajectories. Some paths may grow quickly, others may stagnate, and others may suffer deep drawdowns before recovering or failing to recover at all. That dispersion is not noise around the model. It is part of the model.
This is especially important for understanding drawdowns. Drawdowns are not side effects that appear only when something goes wrong. They are structural features of repeated exposure in a volatile process. Even a growth-oriented capital allocation rule can produce severe temporary losses along the way.
The simulator therefore helps users study not only return potential, but also the instability that can accompany growth-focused staking logic.
Kelly Criterion Simulation Method
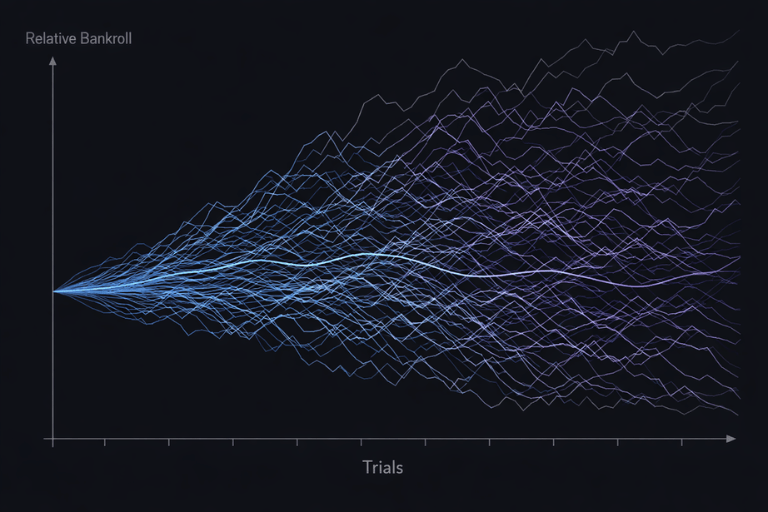
The simulator uses Monte Carlo simulation to generate large numbers of bankroll paths under identical starting assumptions. Each path applies the same odds, probability, and capital fraction logic across repeated independent trials.
Because each run is driven by realized outcomes inside a stochastic process, the individual paths diverge over time. When many paths are aggregated, the resulting distribution reveals structural characteristics such as dispersion, tail risk, drawdown behavior, path dependency, and the gap between typical and extreme outcomes.
This method does not forecast what will happen in a real market. It estimates how the model behaves when the assumptions remain fixed.
Inputs and Assumptions
The simulator uses user-defined probability and odds as fixed inputs. These values define the simulation environment and remain constant throughout each run.
Each trial is treated as independent. The model does not include adaptive behavior, learning, changing conviction, or feedback from previous outcomes. Bankroll evolution is driven only by the predefined capital fraction and the simulated sequence of wins and losses.
This controlled structure is intentional. It allows the Kelly Criterion to be examined inside a stable mathematical environment where the effects of sizing logic can be isolated from changing external conditions.
Why Real-World Kelly Use Is Harder Than the Formula
Real-world betting environments are usually less stable than the model. Probabilities change, odds move, limits appear, execution timing matters, liquidity varies, and outcomes may not be as independent as they first appear.
That matters because the Kelly Criterion is highly sensitive to assumptions. If the estimated edge changes or disappears, a stake size that looked rational under one set of conditions may become too large under another. The formula itself remains the same, but the environment around it does not.
This becomes even more important in fast or fragmented markets. A bettor dealing with sharp line movement, high-frequency decisions, or incomplete information is not operating inside the clean structure assumed by the simulator. The gap between mathematical Kelly and practical Kelly often comes from that difference.
For this reason, the simulator should be read as a model of capital dynamics under fixed assumptions, not as a full representation of how real betting markets behave.
How to Interpret the Kelly Simulator Results
The outputs should be read as distributions rather than point forecasts. Mean outcomes, median outcomes, best-case paths, and worst-case paths may differ substantially because multiplicative bankroll processes are often highly asymmetric.
This is why a single trajectory is rarely informative on its own. A more useful reading comes from comparing the spread of outcomes, the frequency and depth of drawdowns, and the distance between typical paths and extreme paths. Those features reveal how aggressively the model exposes capital under the selected assumptions.
Risk of ruin, drawdown statistics, and tail outcomes should therefore be understood as modeled characteristics of the simulation. They describe what the computational process produces under fixed conditions. They do not directly describe live market probability or guarantee that similar patterns will appear in practice.
Relationship to Other Capital Allocation Models
The Kelly Criterion differs from flat betting because stake size changes with bankroll and assumed edge. It also differs from simple fixed-fraction staking when the chosen fraction is not tied to a formal estimate of edge and payoff structure.
That distinction matters because the Kelly framework is built around proportional exposure inside a growth-oriented model. Other bankroll systems may be simpler, smoother, or easier to apply, but they do not aim at the same growth objective.
This simulator can therefore also be used as a comparative thinking tool. It helps show how Kelly-based sizing behaves differently from static staking models, especially when volatility, compounding, and long-run exposure are central concerns.
Limits of the Model
This simulator excludes estimation error, market adaptation, transaction costs, execution friction, liquidity constraints, and structural breaks. It does not model line movement, hidden correlation, strategy adjustment, behavioral responses, or changes in true probability over time.
Those exclusions are not oversights. They are scope boundaries that preserve a stable simulation environment. The output is constrained entirely by the assumptions encoded in the model, which means the results are useful for understanding structure but incomplete as a representation of live betting conditions.
The simulator is therefore best understood as a mathematical tool for examining bankroll behavior under controlled assumptions.
Scope Boundaries of the Kelly Criterion Simulator
This simulator evaluates mathematical properties of a growth model under fixed probabilistic assumptions. It does not evaluate decisions, strategies, or real-world scenarios. All outputs should be interpreted as descriptive of the computational model itself and not as guidance, recommendations, or prescriptions.
The simulator describes the behavior of a computational model under fixed assumptions. It does not provide advice, recommendations, guarantees, or real-world performance claims.
Author Responsibility
This simulator and its probabilistic assumptions are maintained by Kim Birch. Responsibility is limited to simulation logic, probabilistic structure, and methodological integrity. Responsibility does not extend to interpretation, application, or outcomes derived from use of the simulator.